Read all about this update in this post from the official Microsoft Power Bi team! Here are some new features I’ve been playing around with these couple of days:
Fun with Horizontal slicers!
A new standard Power BI visualization is the ability to add a horizontal slicer (only vertical sliders where available up to this point). It was possible before to download the custom horizontal slicer, but now it’s available right out of the box. It reminds me of the Excel 2013 one, so I am glad they’ve included it in Power BI.

How to use the vertical and horizontal slicers?
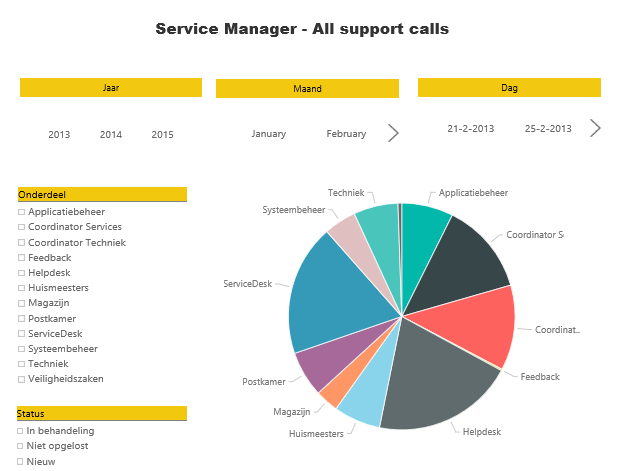
A great way to use these slicers in select is in the scenario that you need to narrow down results per subject and range, for example in a Service Manager scenario:
“As a Service Manager I want to know how many tickets or calls I get per year, month or day, also per department and on which subject”
The screenshot below shows a combination of horizontal and vertical slicers, this way the Service Manager can easily tick all the boxes and have his selection of steering information in seconds!
Global Insights!
While using the Power Map functionality in Excel 2013/2016 you can already display information on a 3d Globe.This custom visualization can now be used in Power BI Desktop as well.
Download the custom visualization Global Map for some global insights!
I’ll update this blog entry later…
