Since the general availability of the ‘Power BI 2.0’ service since July 24, 2015, there have been a lot of updates and improvements. Do you want to be informed about those updates? Follow the official Microsoft Power BI YouTube channel to keep track of the new functionality of the Power BI service, which will be updated monthly.
Here are my top 5 Power BI features based on last December ’15 release:
5. Print your Dashboards or export report data to Excel
At first glance, this doesn’t sound like a killer feature, but it’s actually a highly requested feature by business end-users. With a lot of digital natives out there, printing can feel a bit old-fashioned. But not everyone is used to live in a ‘digital world’, which sometimes result in a conflict between generations 😉
I like the way Power BI gives the user an option to print a Dashboard. There are actually lots of scenario’s where it’s needed to create print-outs, think about keeping your facts & figures as archived material, or bring them to your meetings and offer the reports as a handout.

Print your dashboard in just a few clicks
Another way of getting the data out of Power BI is to export it to Excel, for example if you want to make modifications to the data before you send it out to your stakeholders.

1. Click the … on the right top corner of your dashboard tile

2. Click on export data and your Excel client will receive the data
4. Embedding Power BI reports
Integration possibilities of Power BI reports into other line of business system is a hot topic. One of the questions I got asked a lot is how we can show Power BI reports in SharePoint Online or other Office products like PowerPoint. In the current release these features are currently not available out of the box, but I am sure Microsoft will add these in later releases.
When you are in need of more integration options right now, you can take a look at a company called DevScope (Microsoft Partner), they developed a product called Power BI Tiles which let you embed your Power BI dashboard & reports into SharePoint Online, PowerPoint and Excel. The data within the reports can be either refreshed manual or via your automatic Power BI refreshing scheduler. Really cool!

Add your ‘dynamic reports’ as an app part in SharePoint Online

Add the Office add-in ‘Power BI Tiles’ to display Power BI reports in PowerPoint
3. Custom visualizations, present your reports the way you like
Power BI offers a wide range of visualizations when it comes to displaying your reports. Well known visualizations are for example the Pie, Line and Bar charts.
Sometimes, you need a specific visual to really show your data in the intended way. As a Developer you can extend the current out of the box Power BI visuals with your own creations. This way you can present your data in any way you see fit. Visit the Custom Visuals Gallery site to get started.


Nice new additions to the Power BI custom visual gallery are the ability to create your own floor plans, wordcloud and worldmap, it’s a free download so try it out!
2. Get your data from virtually anywhere!
Getting data out of applications within your Enterprise, or from other external systems, can really be a technical endeavor. Power BI ‘content packs’ are prebuild connectors that can connect to a large collection of SaaS applications (Microsoft and non-Microsoft services).
Preconfigured dashboards are used to display the data which can be modified according to your requirements. The only thing that you need to do, is to enter the URL of your online service and provide your username and password. This will automatically setup the preconfigured dashboards. Getting data has never been that easy!
More and more applications are offered as SaaS these days, so application developers can create their own ‘content packs’ and offer them in the Azure store. The Power BI team is also working with other popular services to add new content packs every week. This way you can use the data from other services and setup and deliver your dashboard in minutes.


A small selection of available content packs, visit Content Packs Services for the entire offering
1. Ask Cortana anything about your data, get insights, instantly!
What if you are able to ask questions to your computer in a natural language, and your computer will answer them? The future is now!
With the Windows 10 OS and Cortana in place, you can use your voice to ask Cortana a question about your data in Power BI. You can configure your Power BI dataset so Cortana is able to use this data, in order to provide you with the custom insights that you need.
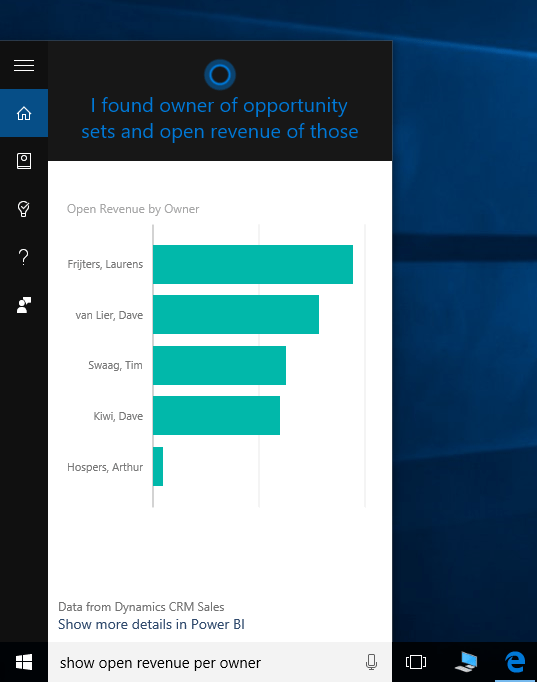
Hey Cortana! Show open revenue per owner, Cortana will look up the information in Dynamics CRM Online and gives me an interactive Power BI report as a result!
The future looks promising
The combination of Power BI, Cortana is really powerful and shows a lot of potential for Business Intelligence scenario’s , especially in combination with upcoming IoT devices. I am really curious about the next update of Power BI and smart and improved new features 🙂

Hi, great post, we just published a SharePoint add-in to the Microsoft Store that allows for Power BI reports and dashboards in SharePoint as well as sending Outlook Group notifications and alerts. You can see it here: https://goo.gl/cwEhQN